One of the neat things about the people in the baseball research community is how willing many of them are to continually question the status quo. Maybe it’s because sabermetrics is itself a relatively new field, and so there’s a humility there. Assumptions always, always need to be questioned.
Case in point: a great post by Ken Arneson entitled “10 things I believe about baseball without evidence.” He uses the latest failure of the Oakland A’s in the recent MLB playoffs to highlight areas of baseball we still don’t understand, and for which we may not even be asking the right questions. Why, for example, haven’t the A’s advanced to the World Series for decades despite fielding good and often great teams? Yes there’s luck and randomness, but at some point the weight of the evidence encourages you to take a second look. Otherwise, you become as dogmatic as those who still point to RBIs as the measure of the quality of a baseball batter. Which they are not.
One of the thought-provoking things Arneson brings up is the question of whether the tools we use shape the way we study phenomena–really, the way we think–and therefore unconsciously limit the kinds of questions we choose to ask. His example is the use of SQL in creating queries and the inherent assumptions of that datatype that objects within a SQL database are individual events with no precedence or dependence upon others. And yet, as he points out, the act of hitting a baseball is an ongoing dialog between pitcher and batter. Prior events, we believe, have a strong influence on the outcome. Arneson draws an analogy to linguistic relativity, the hypothesis that the language a person speaks influences aspects of her cognition.
So let me examine this concept in the context of another area of inquiry–biological research–and ask whether something similar might be affecting (and limiting) the kinds of experiments we do and the questions we ask.
I’ve spent the bulk of my scientific career working in enabling technologies–microarrays, next-gen sequencing, genomics, and such. These are, generally, data-rich approaches that require use of statistics to help winnow the rice from the bran. Not that the bran isn’t also good for you! Which will become a relevant metaphor in a few paragraphs.
In any case, and as an example of data-rich approaches, Next-gen sequencing experiments designed to look at which genes are turned on or off and up or down, across experimental conditions can result in over 20,000 measurements per sample. And that’s assuming one uses just the summary statistic Reads per Kilobase per Million (RPKM) which gives you one number per gene! The abundance of data has led to the development of different algorithms and metrics to test for the significance of results (and no shortage of fun, spirited debates across the bioinformatics community) in order to identify the most robust results quickly. After all no one wants to spend their career parsing through each of the 20,000 measurements across dozens or hundreds of samples, looking for the interesting tidbits.
Statistics, then, come into play. We choose a p-value we are comfortable with or, more practically, that returns a manageable list of genes that seem to have been changed by the experimental condition. Manageable by a scientist that is. Because often, once the number crunching is done, the list must then be subject to manual inspection, deduction, hypothesis generation, and inductive reasoning by individual scientists who have a very finite amount of time.
Drawing lines in the sand
But, that’s all well and good, right? Statistics are meant to show us what is real, isn’t that right?
Well, no they aren’t. And that’s misconception number one, and starts getting us into the problems of dogma and language and assumption that I think is a problem in the practice of biological research.
Many people have spent a lot of words discussing how statistics do not, in fact, tell us what is “true” and what is “false.” I’d suggest this Economist article on replication, and especially their great graphic partway down the page. Statistical tests only tell us how likely it is that a given observation would occur given that the null hypothesis is correct–that is, that our much more interesting hypothesis isn’t actually true.
So returning to the gene expression example I’ve been detailing, just because a set of observations pass a statistical cutoff does not mean incontrovertibly that they are “true,” any more than the many observations that did not pass the cutoff are false. Just like rice bran is not devoid of nutritive value. The problem is that, on a practical level we often use statistics in this way.
There have certainly been many who have worked to spread the more nuanced view of how to view statistics, but this is like rowing up the Columbia River in a cardboard boat with a teaspoon for a paddle. One of those really flimsy ones made of reconstituted corn starch. You know the kind I’m talking about. The kind that melt in your coffee.
It’s hard because nuances aren’t intuitively obvious. It’s much easier to view a p-value cutoff as a line in the sand, a binary toggle, a really nice, high fence separating your neatly manicured backyard from the weed-fest just across the way at your neighbor’s. Even when we do grasp the distinction, practicality can lead us to view the cutoff perhaps with more strength than we should or intend. After all, if the alternative to looking at fifty observations is considering five hundred or five thousand, there’s a real cost-benefit analysis that has to occur–consciously or unconsciously. We make a choice: we’ll give up on the possible “true” observations that didn’t make the cutoff so we can move ahead on more experiments with the observations that did.
But when we do that, we affect both our own thinking about what is “true” and that of anyone else who follows behind and never sees the list that didn’t pass the bar.
Bayesing at the moon
So that’s one way in which how the tools we use and the way we use them affect the way we think. Here’s another: the type of statistic we use also has inherent assumptions. Here I’m thinking of Fisherian, or Frequentist, statistics versus, for example, those of Bayes. “Fisher” and “Bayes” are short-hand for different statistical approaches pioneered, respectively, by Ronald Fisher and Thomas Bayes. A simple, meaningful distinction between the two is that Fisherian statistics assume no prior knowledge or relationship between a given statistical test and other tests that have gone before. Even if something similar (or identical) has been tested in the past. Bayesian approaches instead incorporate a prior probability when assessing the results of a test, and use every test result to update that probability.
I was going to write more, but–thank you internet!–I very quickly found the following page from simplystatistics.org about the Bayesian vs. Frequentist debate, which also as a bonus includes an awesome XKCD cartoon. That post by Rafael Irizarry points out that there’s a false dichotomy in the debate. Practical statisticians (unlike, say, political parties) use the approach that is appropriate and reasonable and supported for a given application. He also cogently points out that problems instead arise when scientists whose background in statistics is less robust do not think critically when choosing the statistical approach they use in analyzing experiments–or even realize there is a choice.
As an example, I can remember on more than one occasion asking why three replicates were planned for an experiment and being told that three was necessary to calculate a standard deviation so that a t-test could be performed. That’s it. The planned statistical test was dictating the parameters of the experiment, rather than questions of power, effect size, variability, etc…
And so I worry that the Frequentist view, which I believe is the main, and often only, statistical approach we are taught as biomedical scientists, leads us astray. When a p-value generated by a Frequentist test is viewed as the gold standard, it closes off alternative methods for analyzing data and understanding the results of our experiments. It could also lead us to the third way I think our approaches affect our thinking namely:
How easy it is to forget that we’re all little snowflakes
Frequentist analyses work on the group level. They compare two different groups and ask if the distributions and means of each group are different enough to say that something other than the null hypothesis could be going on. What becomes implicit in that approach, I think, is the idea that the groups themselves are relatively homogenous. Disease versus healthy. Treated versus untreated. I’m not saying any differences we find between the groups aren’t real–as pointed out in the post linked above, the identification of smoking as a cancer risk was found using a Frequentist approach–but rather that looking at the group level all the time might predispose us to ignore variation at the individual level. Even as variation at the individual level is the base from which those tests derive their power.
What do I mean? Let’s talk about precision medicine, the concept of creating individualized treatment plans for patients, and contrast that with the concept of standard of care (I realize these are not mutually exclusive, but let me construct a straw person for a bit). Many medical treatments fall under the heading of standard of care, from specific vaccination schedules for infants and toddlers to the treatment for a sprained ankle (RICE away). They are standard and applied uniformly to patients because, by and large, they are viewed as the most effective approach for a given health problem or intervention based on years of experience and large amounts of practical experience and population-based data.
And there’s the rub. Because precision medicine moves in the opposite direction. It tries to figure out whether there’s something going on within the groups. It pushes against a “one size fits all” mentality in the hope that smaller subdivisions do exist, and that they might provide improvement in outcomes. Here’re some figures to demonstrate these concepts:
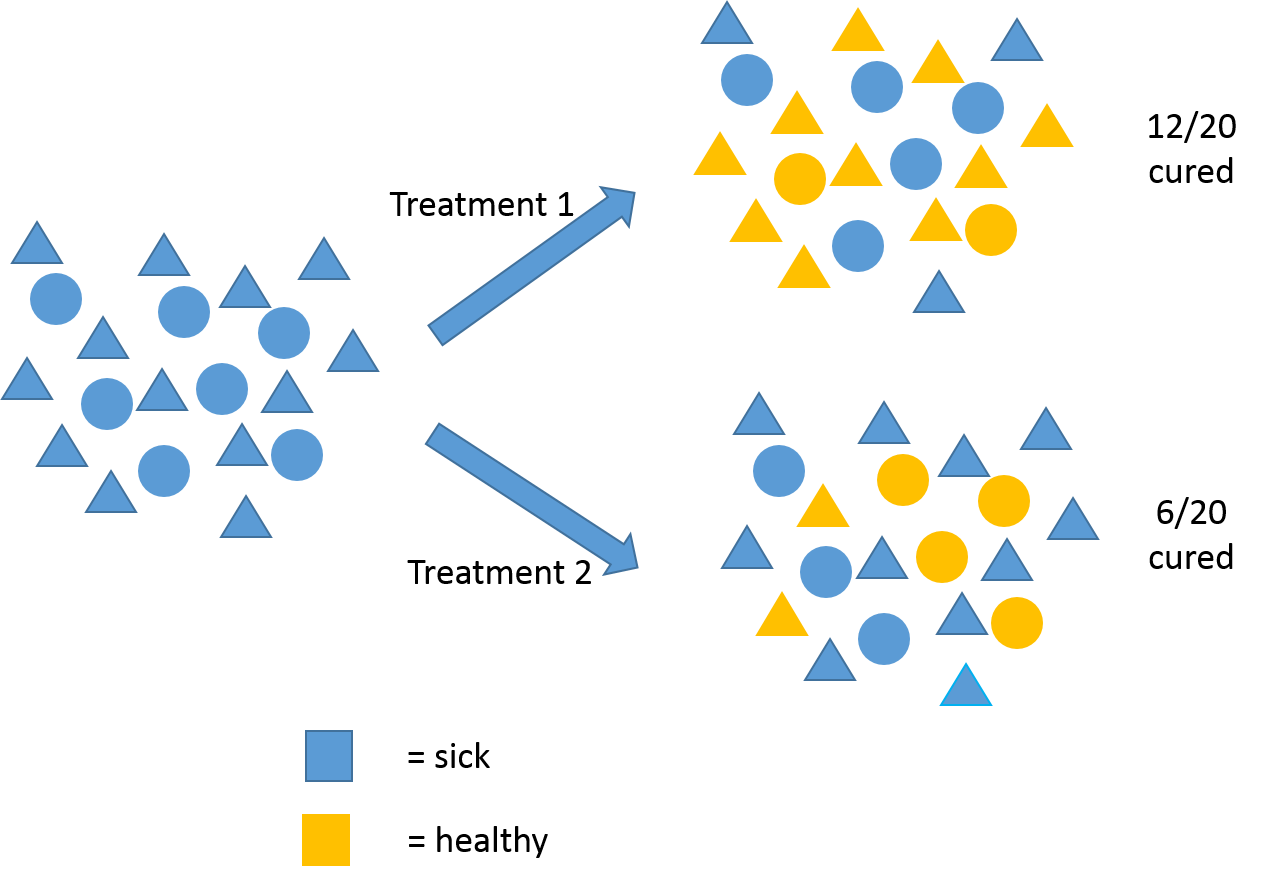
This is the paradigm of the one-size-fits-all standard of care. After rigorous, population-wide study, it’s found that for patients with a given ailment, Treatment 1 leads to a higher number of cured individuals than Treatment 2. So, Treatment 1 becomes the standard of care for everyone and about 60% of patients get cured. But notice, patients aren’t all alike. Which leads us to:
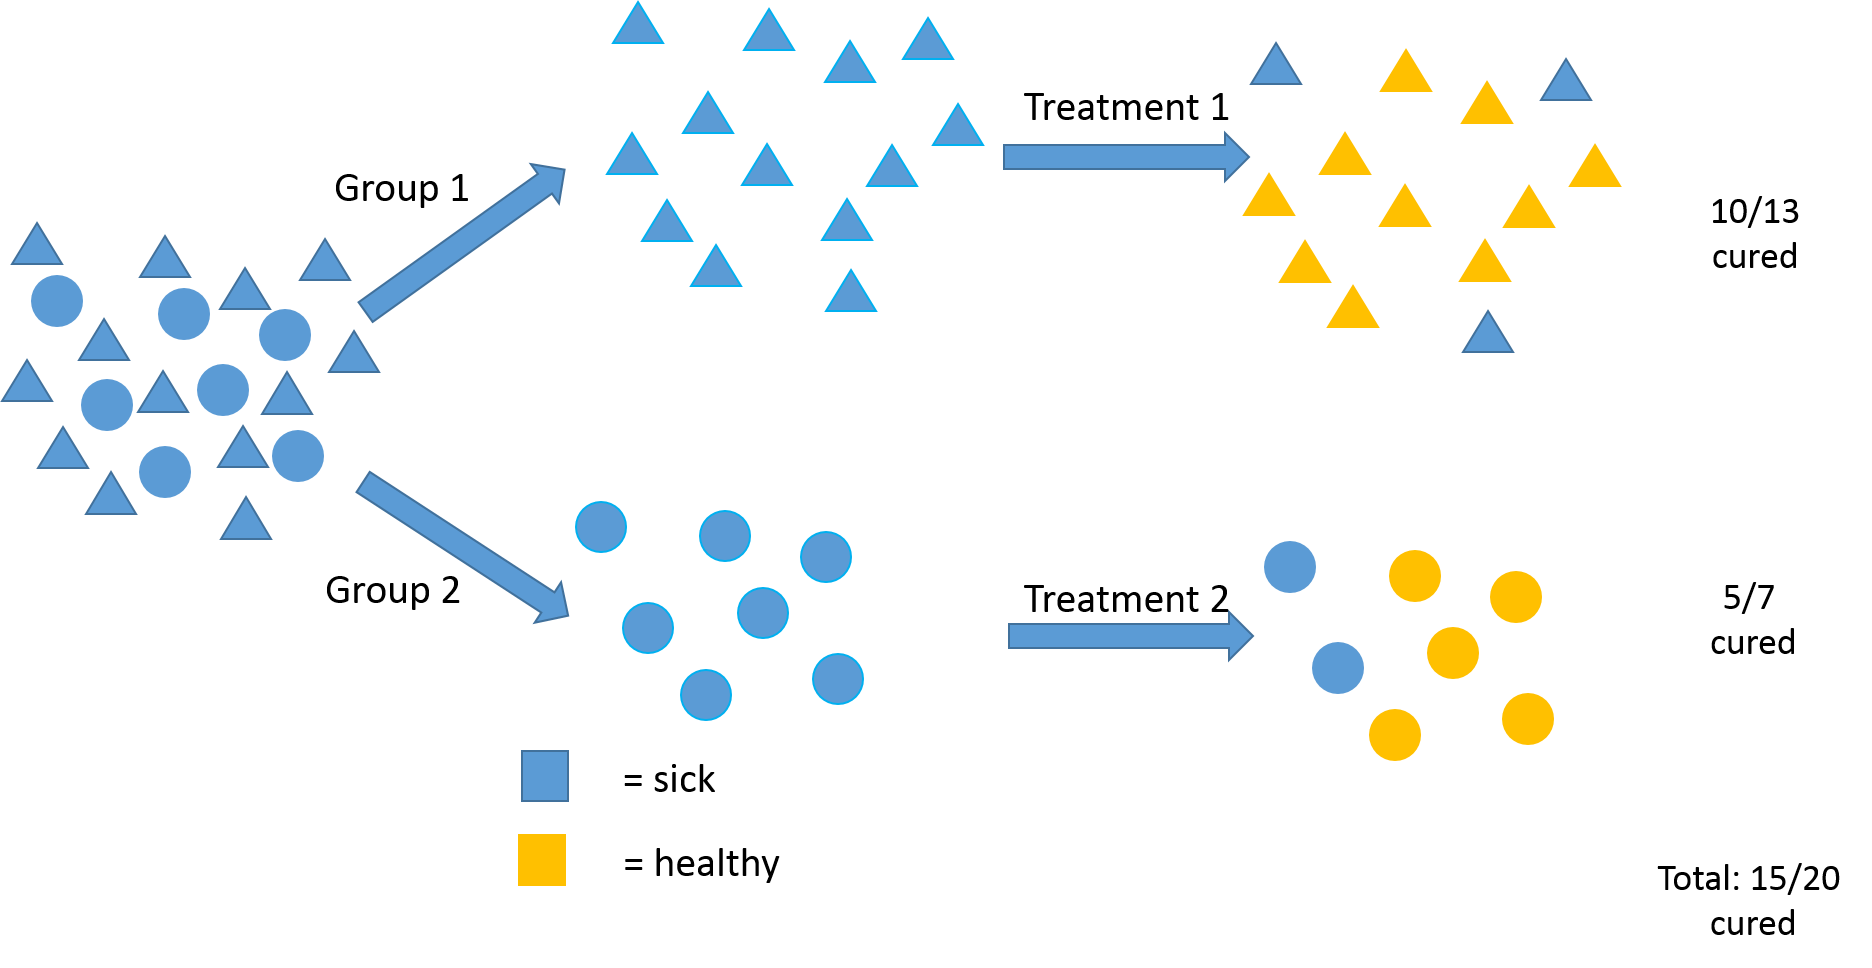
This instead is a precision medicine approach. In this example, research shows that patients with a given disease are not all alike and that the circular people actually respond better to Treatment 2. So, if you stratify your patients up front, and target your treatment accordingly, a higher number of people overall are cured at the end–in this example 75%.
Precision medicine as an approach has been gaining traction over the past several years–and hit prime time with the Presidential State of the Union Address–but there is resistance. Some of it is financial–there are fears it will increase health costs to have too many kinds of treatments, while also creating the burden of trying to stratify patients correctly. Some resistance is due to our science just not being there yet. Finding stratification markers is hard. But some resistance I think, returning finally to the theme of this post, is simply due to people being trained to think one way and resisting the change to think in another.
I do see signs that this mindset is changing in biomedical research and healthcare in general, and I think that’s a good thing. There are a lot of trends moving people away from thinking about group-level characteristics and toward more individual monitoring, tracking and understanding. Which is not to say that group-level thinking should be neglected. Rather, I think there just needs to be more of a balance, even though that makes it harder, even though that requires us to spend more time thinking, and being aware of the biases that could be affecting us as we make choices and decisions in performing our research and going about our lives.
