All opinions of the interviewer are my own and do not necessarily reflect those of Novo Nordisk.
One of the huge and perhaps still underappreciated aspects of the internet age is the digitization of information. While the invention of the printing press made the copying of information easy, quick and accurate, print still relied on books and other printed materials that were moved from place to place to spread information. Today digitization of information, cheap (almost free) storage, and the pervasiveness of the internet have vastly reduced barriers to use, transmission and analysis of information.
In an earlier post I described the project by researchers at the University of Pittsburgh that digitized US disease reports over the past 120+ years, creating a computable and freely available database of disease incidence in the US (Project Tycho, http://www.tycho.pitt.edu/) This incredible resource is there for anyone to download and use for research ranging from studies of vaccine efficacy to the building of epidemiological models to making regional public health analyses and comparisons.
Their work fascinates me both for what it said about vaccines and also for its connection to larger issues like Big Data in Public Health. I contacted the lead researcher on the project, Dr. Willem G. van Panhuis and he very kindly consented to an interview. What follows is our conversation about his work and the implications of this approach for Public Health research.
![vanPanhuis,Wilbert[brianCohen20131113] (12)_resized](https://kyleserikawa.com/wp-content/uploads/2014/01/vanpanhuiswilbertbriancohen20131113-12_resized.jpg)
Dr. Willem van Panhuis. Image credit: Brian Cohen, 2013
Kyle Serikawa: Making this effort to digitize the disease records over the past ~120 years sounds like a pretty colossal undertaking. What inspired you and your colleagues to undertake this work?
Dr. Willem van Panhuis: One of the main goals of our center is to make computational models of how diseases spread and are transmitted. We’re inspired by the idea that by making computational models we can help decision makers with their policy choices. For example, in pandemics, we believe computational models will help decision makers to test their assumptions, to see how making different decisions will have different impacts.
So this led us to the thinking behind the current work. We believe that having better and more complete data will lead to better models and better decisions. Therefore, we needed better data.
On top of this, each model needs to be disease specific because each disease acts differently in how it spreads and what effects it has. In contrast, however, the basic data collection process that goes into creating the model for each disease is actually pretty similar across diseases. There is contacting those with the records of disease prevalence and its spread over time, collecting the data and then making the data ready for analysis. There’s considerable effort in that last part, especially as Health Departments often do not have the capacity to spend a lot of time and effort on responding to data requests by scientists.
The challenges are similar–we go through the same process every time we want to model a disease–so when we learned that a great source of much of the disease data in the public domain is in the form of these weekly surveillance reports published in MMWR and precursor journals, we had the idea: if we digitize the data once for all the diseases that would provide a useful resource for everybody.
We can make models for ourselves, but we can also allow others to do the same without duplication of effort.
KS: Do you see this catching on in your field?
WvP: Well, we hope to be part of a new way of doing research in Public Health. Instead of each group gathering and digitizing its own data, we can learn from Genomics and Astronomy. Shared data can have community benefits.
Public health data are not available from a central, integrated system and historical data are often not available in computer-readable format. The overall data landscape is pretty scattered. There are many small, localized datasets, but few data intensive studies. Big datasets that combine historical data on multiple diseases across a wide geographical area are generally not available in the Public Health setting. That brought us to our current work. It seemed like the right mission and right time to do this. We found the Gates Foundation and NIH willing to help fund this through our existing modeling grants. Even though this initial effort started relatively small in terms of funding and staffing, we think the tremendous value generated by building databases like this greatly exceeds the cost of investment.
KS: What do you see as possible issues or barriers to doing Public Health research this way?
WvP: The biggest issue is making the data available. We are making all of the data available so that people can download it and also do these kinds of analyses. This isn’t always the case, and so we’re kind of taking a stand on this.
Now, in Public Health there are challenges to making data available, issues like privacy, etc. But, even so, aggregated, anonymized data can be made available. We want the raw data to be made available. That gives added transparency and the ability for other labs to really test reproducibility of findings.
KS: Can you describe the nuts and bolts of the process to get these paper records digitized? Do you have an estimate of how many hours this took and how many researchers?
WvP: This is a fairly new area for us. Before we could start we had to get an idea of what the data actually looked like. So to start we took data records from 1888 forward and looked at the tables from the first and last week of each year for each disease to see how data was entered, terms used, formats, etc., as well as how those changed over time. We were discovering roughly what the content would be, how many tables we were likely to find, how many diseases, and so on.
We then started using students to double enter data. But we found that didn’t go fast enough. Then we found an organization, Digital Divide Data that is a nonprofit with a unique model. This group provides scholarship and work-study opportunities to students from the developing world. Those individuals work for the company in data management tasks while at the same time gaining skills and education in local universities. They could handle our data management, quality control and data entry tasks.
They would download ten year chunks of pdfs and enter the data while also providing feedback to us on progress and problems. In general it took them about one month to enter ten years of data.
After the first round of data entry, we had a QC round and found that a large chunk of data had to be re-entered or modified due to the poor quality of the scans they were working with. So, we had to find the original journals in libraries, go back and scan in new pdfs.
So we ended up with two rounds of data entry and a general one month turnaround time for a given chunk of data. The nice thing about Digital Divide Data is they were able to tailor their staffing to meet our needs. As the project moved forward in time and there were more records, they were able to just increase staff dedicated to our project so our timelines didn’t slip.
In addition our own analytical system was continually checking and throwing out warnings whenever it found a conflict in data, allowing us to reconcile the problems.
Overall we had data entry errors of less than one in 10,000 characters, which we were very happy with. Our lesson was that we can’t always do these kinds of repetitive entry jobs with students; companies with experience make a real difference.
KS: The introduction to this paper in NEJM makes a point of discussing how US disease data, while collected weekly for the past century+, has not been computable until now. What kinds of efforts are going on to try and digitize paper health records of all kinds in the US?
WvP: I’m not really well aware of many other efforts. There is an opportunity here, every group is digitizing data at some level.
There is a great need but just not very much support for data digitization. We call this “data rescue” as paper records, and antiquated electronic data, will get lost if it’s not actively preserved. I’ve been communicating with an environmental data rescue organization that is trying to digitize historical environmental records. The worry is, if you don’t digitize these records soon, the data will disappear. The current online versions of historical data are not always in good shape–they’re often scans that cannot be automatically transferred in computer-readable files.
The environmental data rescue organization is, for example, going after information about species numbers and distribution. But they’re running up against a lack of funding. While there’s some momentum, there’s not much support for entering tabular data at a large scale such as disease data, but also other types of data such as NOAA climate data. Again, there are small organizations doing things here and there, but I am not aware of any large-scale effort in our field.
The biggest reason is that funding is still very results-focused, not data focused. For example, if you have a massive dataset that could be digitized, like death certification information, but without an innovative analytical question, you won’t be able to get funding. Even if other researchers would have questions if the data were just made available.
KS: As you described earlier, even your work was driven by the idea that models would be produced, not just that you would digitize the disease information.
WvP: Right. Our Gates and NIH funding was originally mostly for building models, not for collecting and entering data. We were able to work with them to allow us to use some of our funding for the digitization work.
We’d like to build some momentum behind the idea that there are different things that should be funded. Shift the paradigm. Some people are good at data gathering and collating, and they should be funded to do just that, and there will be others who have specific data analysis skills.
KS: What other groups have you learned about that are working towards this approach of creating datasets for general use?
WvP: Well, the Open Government Movement is one. They make data available from the Federal Government. The idea is that if they make this data available there will be innovation that arises and creative people will find ways to use that data.
We know that Public Health agencies don’t have the time and energy to dig through large datasets, but if it’s available, others can come up with ideas. There is a challenge, really, that’s limiting Big Data approaches in our sector. We are results and hypothesis focused, and not always very exploration focused.
I want to touch on another challenge in big dataset creation in Public Health, which is that the initial data entry has to be done manually. Data entry is hard because so often the columns and even table formats change over time. Optical character recognition and image processing just aren’t up to the task. It would be great if computational systems existed that would recognize table shape which would make leaps in making historical data available. Instead we’re where we were at thousands of years ago. Copying things manually. We could use some progress there.
KS: What do you see as the key findings of your study and the implications of those findings for public health policy? What kinds of analyses do you and your colleagues plan to follow up on this initial study?
WvP: Well, the key findings are, number one, about the dataset itself. That is, this system of disease reports has been very adaptable and flexible, changing as public health priorities changed over time. We can use these data to do work on several different Public Health priorities and patterns.
The largest immediate implication is the vaccine angle which shows the patterns very well. For example, with measles we see the data very well replicating what was has been described extensively in the past–that measles initially appeared on an annual cycle which moved to biennial and then triennial. And then there was the effect of vaccination. We just made plots and showed the data and did a basic type of analysis. We really wanted to show the value of the Public Health programs, especially at a time when the value of larger scale efforts like vaccination are being questioned. We wanted to make estimates of the impact of vaccination programs more clear and robust. This is how we found that vaccination programs in the US have prevented about 100 million cases of childhood disease.
We were also lacking a disease dataset to compare to census data. To make good models of disease we want to be able to compare disease to other kinds of data such as population data, historical information, and the dynamics of population growth and spread, climate–any dataset, really, that goes back in time and can be linked to this current disease dataset. These additional data can provide great insight in the causation of disease epidemics.
Many types of data are very scarce. We don’t have detailed data, for example, on things like sewer treatment and piped water. But we can infer some of that from other data, and this can also be added to our models.
We’d also like to bring this data to the international level. We want our analyses and data to eventually be translatable abroad. We want to include data on other countries. It comes back again to data rescue. We’re definitely hoping for progress there; some governments have shown great interest in making better use of their data..
KS: One of the fascinating aspects of the internet and connectivity is how it reduces the need for duplication of effort and makes it clear how information is the ultimate currency in the digital age. Whether it’s plans for 3D printing different objects, youTube videos on how to fix your car, or datasets like the one you and your colleague have provided, the digitization of information is having profound effects on many different kinds of endeavors. While there is a lot of buzz and ambiguity about Big Data and how to define that, much less understand what to do with it, it seems to me this dataset meets one of the key functional definitions I have for Big Data in that it transforms quantity into quality. Or as the article states, “detailed long-term data…has yielded new insights into disease-transmission dynamics.” How do you see Big Data playing a role in public health research moving forward?
WvP: You know at first, we weren’t really thinking of this as “Big Data.” All told, our actual dataset is less than ten Gigabytes! That’s tiny compared to the terabytes you hear about in other fields. But on the other hand, it’s one of the most comprehensive Public Health Datasets in the world right now. So in terms of Public Health, it’s about as big as it gets right now.
Then there is another prospect we can see in the coming interaction between Public Health and Medicine. In medicine there are now datasets of things like functional PET scans, CT scans, etc., and these are becoming used routinely in personalized medicine. Add to that the large datasets coming out of work on Electronic Medical Records (EMRs), and you can see how we’re eventually going to have very big datasets in medicine that will be useful in Public Health when we fold that all in. Primary care, after all, is one aspect of Public Health policies.
This is not just going to pose a huge challenge, but also an enormous opportunity. We think what we’re doing now shows that in Public Health we can use large datasets, but we have to get ready for EMRs.
You could distinguish two kinds of roles for Public Health. First, to detect and stop outbreaks. And second, to learn about disease, find out what causes it, and what we can do to prevent it. We have a lot that we do with the first but not as much with the second. Maybe using larger datasets will help with that.
Getting back to the point about what is Big Data, it seems that in Public Health we are definitely in a functional Big Data problem. Health care providers are required to report all kinds of health information to their local Departments of Public Health. The data is collected, archived…and then often not much else is done with the data. Because of limited time and staff to exploit all the opportunities provided by these data.
KS: Another aspect of this paper that’s striking is the use of visualization tools. How did you go about selecting the particular visualizations (ie, the spiral availability graph and the combined heatmap/yearly incidence histogram display for each disease)? Can you comment on how you see visualization as playing a role in “Big Data” analyses like this?
WvP: The importance of visualizations in the analysis of large scale data cannot be overstated. In particular images that provide an overview of major patterns but that preserve data granularity, i.e. detail. We designed the circle diagram, inspired by some circular phylogenetic trees. I basically first spent some time thinking about what I wanted to show with the image, in this case, the entire history of weekly disease surveillance in the US in one snapshot. Then I spent time trying to figure out how to make the best use of the space and came up with the circle after browsing all types of visualizations from other fields. The heatmap display has a similar story. I tried to show large scale population level patterns without sacrificing the detail provided by the data. This display had been used before however, in data intensive infectious disease studies. The dramatic decline of disease incidence after vaccine licensure showed a great dichotomy between periods with high and low disease incidence rates. Especially when more and more data become available, it will be increasingly important to visualize not only selected parts of the data with potential for biased projections, but to show as much as possible of the grand overview, before drilling down to particular details. I think this is a great area for cross-disciplinary inspiration as standard graphs in one domain can be highly innovative in another.
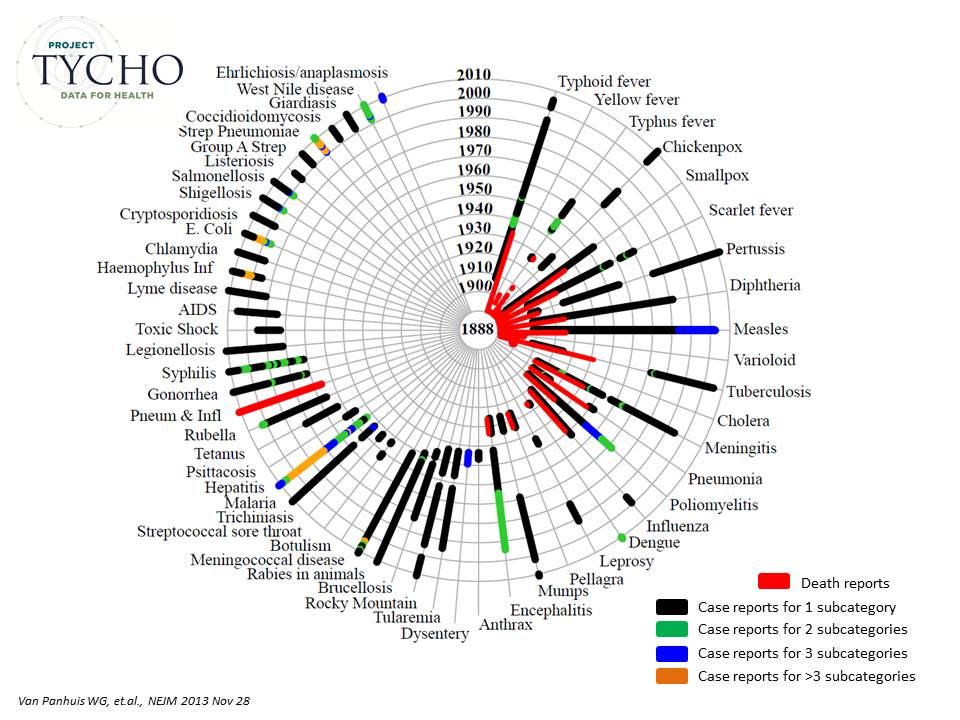
Figure 1 from the paper.
KS: Would you have any concluding comments or remarks about this study and its potential impact, both from the technical/research perspective, and from the public policy perspective?
WvP: I really hope that the data that we currently provide will be used extensively and that value can be demonstrated. We are betting that the worldwide community will muster an incredible amount of innovation and creativity in using these data for the public good and depend on an extensive use to make a case for these types of data driven projects. If we can demonstrate value and success, a paradigm shift may actually occur, with many more similar datasets emerging, working towards a standard of freely flowing data in public health for the public good.
